Analytics Dashboard
The Analytics Dashboard is the main reporting view, accessible from AI Analytics → Analytics Dashboard in the admin sidebar.
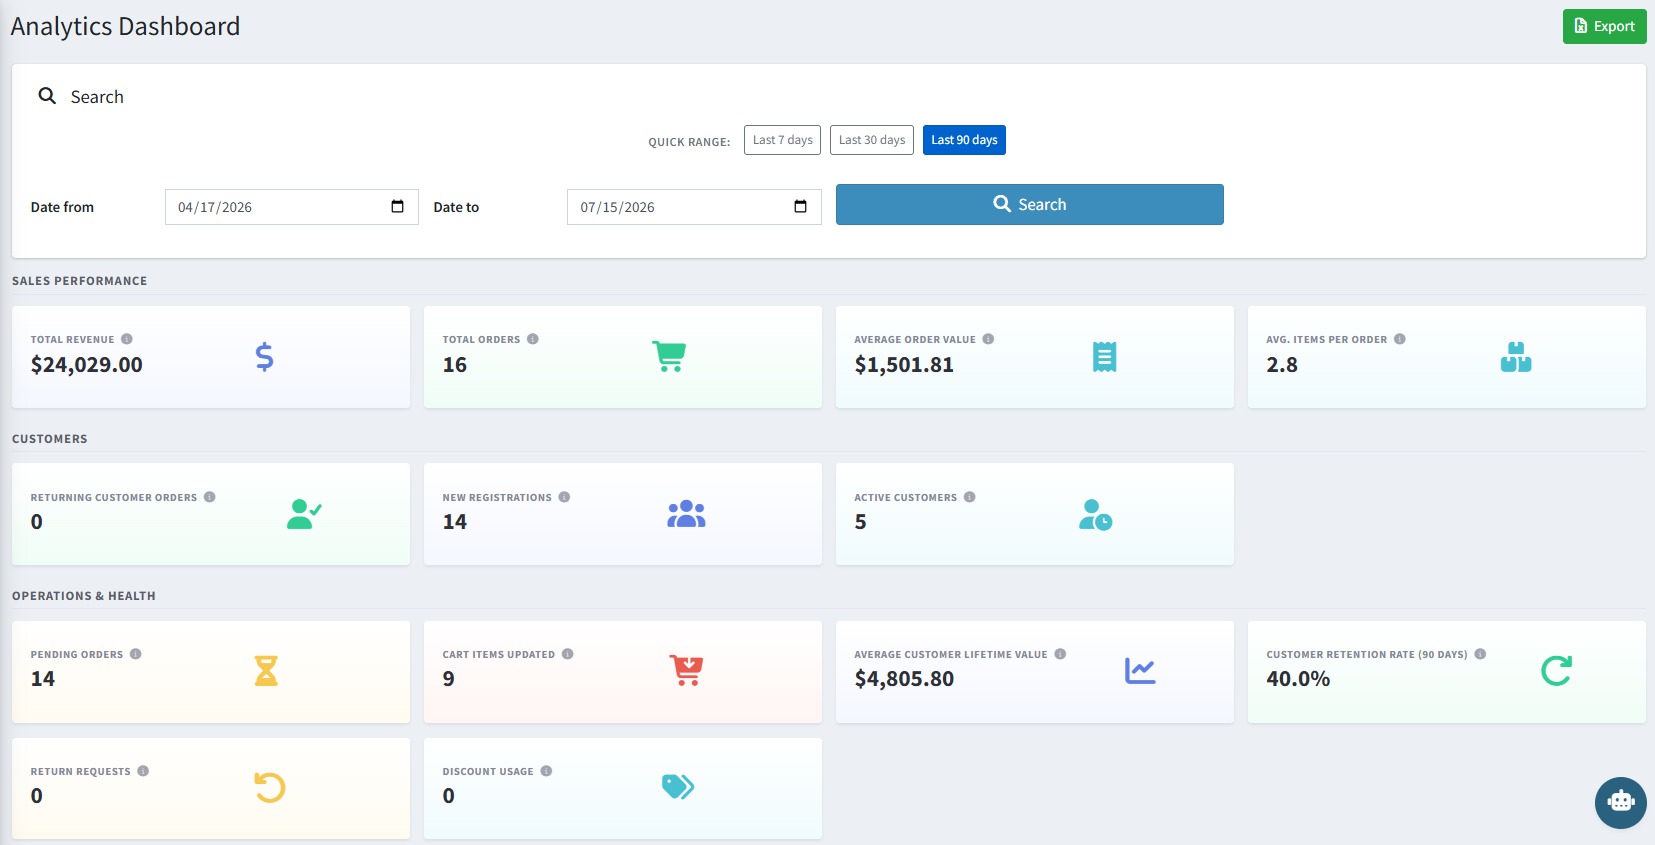
Filter Bar
| Control |
Description |
| Search |
Free-text search box to narrow the dashboard view (e.g. by keyword). |
| Quick Range |
One-click shortcuts: Last 7 days, Last 30 days, Last 90 days. |
| Date from / Date to |
Custom date range for the analytics period. |
| Search button |
Applies the selected filters and reloads all cards, charts, and tables. |
| Export |
Downloads the current dashboard data as a .xlsx file. |
| Card |
Description |
| Total Revenue |
Sum of order totals in the selected period. |
| Total Orders |
Count of paid and partially refunded orders in the selected period. |
| Average Order Value |
Total Revenue divided by Total Orders. |
| Avg. Items Per Order |
Average number of line items per order in the selected period. |
Customers
| Card |
Description |
| Returning Customer Orders |
Count of orders placed by customers who have ordered before. |
| New Registrations |
Count of new customer accounts created in the selected period. |
| Active Customers |
Count of unique customers who placed at least one order in the period. |
Operations & Health
| Card |
Description |
| Pending Orders |
Count of orders currently in Pending status. |
| Cart Items Updated |
Count of shopping cart item changes — used as a cart-activity / abandonment signal. |
| Average Customer Lifetime Value |
Average total revenue generated per customer. |
| Customer Retention Rate (90 days) |
Percentage of customers who made a second purchase within 90 days. |
| Return Requests |
Count of return requests submitted in the selected period. |
| Discount Usage |
Count of orders where a discount was applied. |
Trend Charts & Breakdowns
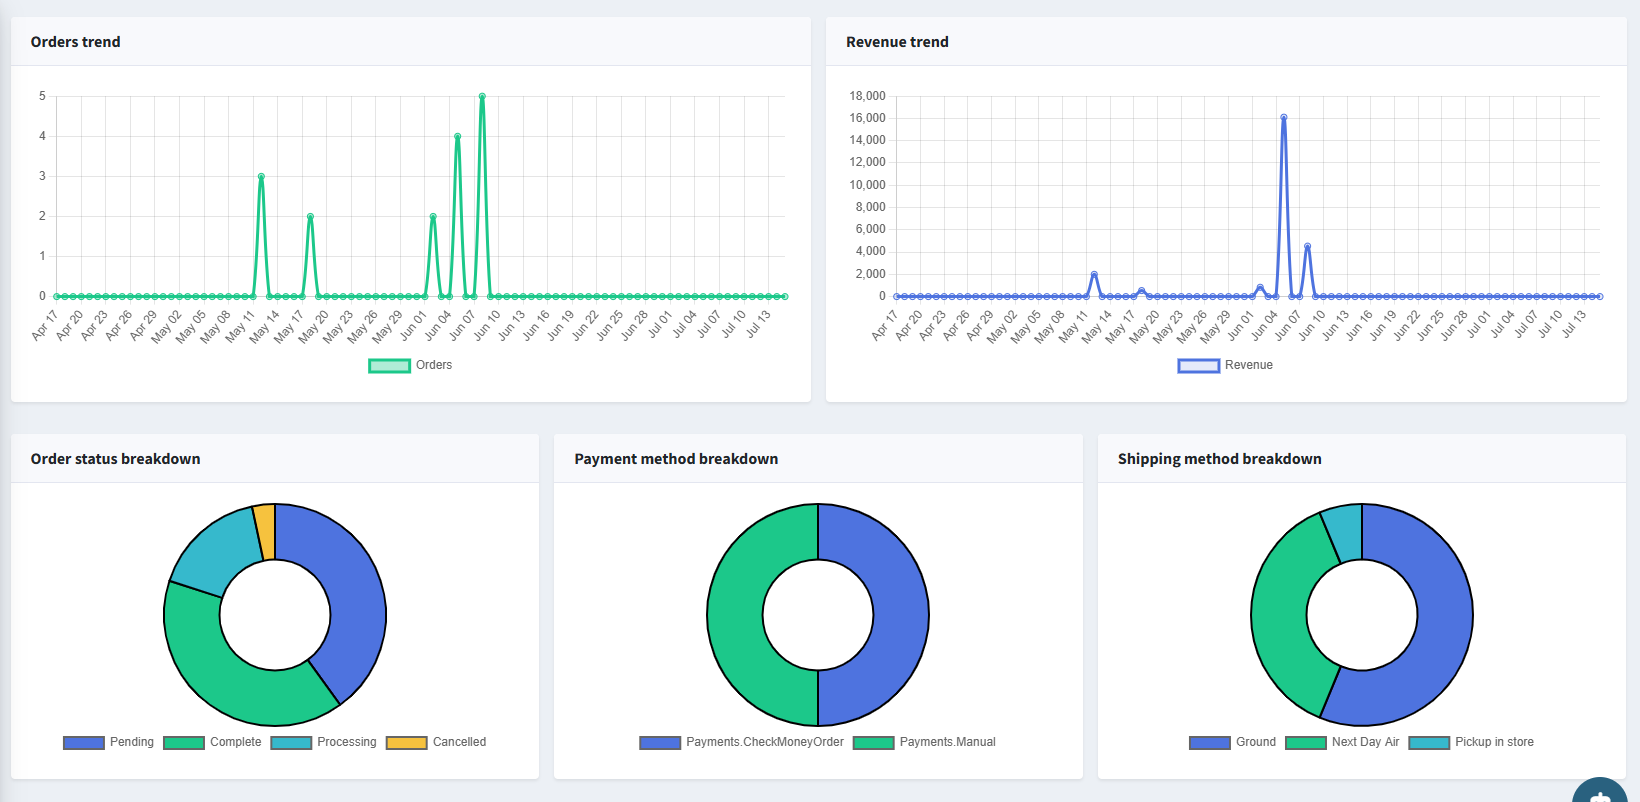
| Chart |
Type |
Description |
| Orders trend |
Line chart |
Number of orders placed per day across the selected date range. |
| Revenue trend |
Line chart |
Daily revenue across the selected date range. |
| Order status breakdown |
Donut chart |
Share of orders by status: Pending, Complete, Processing, Cancelled. |
| Payment method breakdown |
Donut chart |
Share of orders by payment method (e.g. Check/Money Order, Manual). |
| Shipping method breakdown |
Donut chart |
Share of orders by shipping method (e.g. Ground, Next Day Air, Pickup in store). |
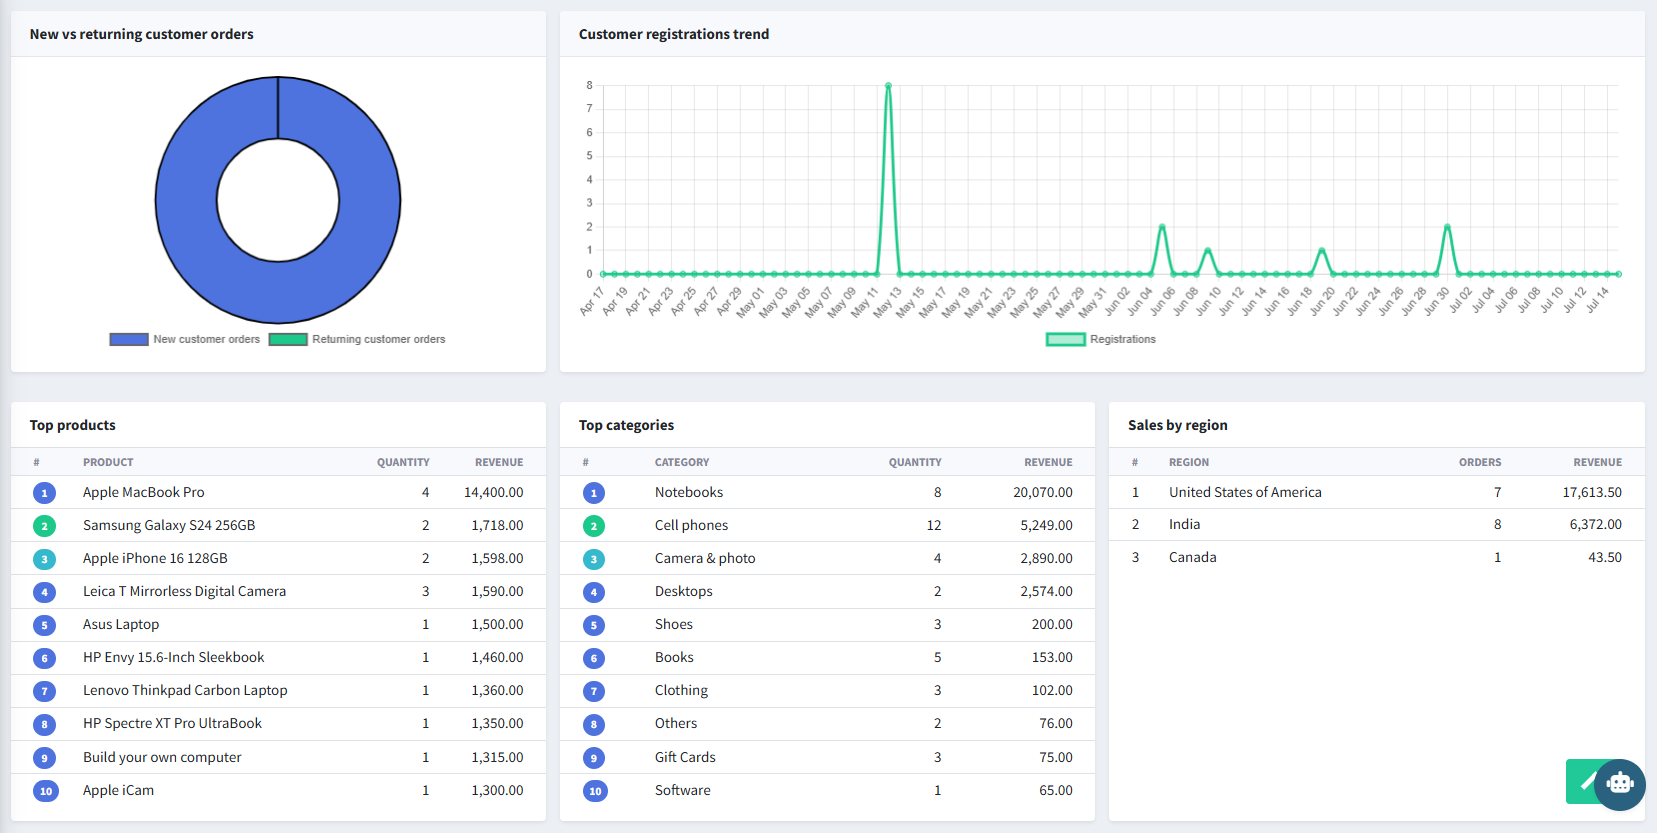
| Section |
Description |
| New vs returning customer orders |
Donut chart comparing orders from new customers vs. returning customers. |
| Customer registrations trend |
Line chart of new customer registrations per day. |
| Top products |
Ranked table (Rank, Product, Quantity, Revenue) — top 10 products by revenue. |
| Top categories |
Ranked table (Rank, Category, Quantity, Revenue) — top 10 categories by revenue. |
| Sales by region |
Ranked table (Rank, Region, Orders, Revenue) — sales grouped by billing/shipping region. |
Excel Export
Clicking Export downloads a .xlsx file containing the dashboard's KPI summary, daily revenue and orders, and the top products, top categories, and sales-by-region tables for the selected period.
← Previous | Next →